Stuck in Traffic

My passion for science goes to physics in general. I am endlessly fascinated by the ability of physics to let us understand why the world works in such crazy ways and how humans influence it and are influenced by it. Such is also the the case for traffic, where drivers control their individual vehicles in cooperation and sometimes in competition with each other. I am sure you have been stuck in traffic many times, and if you are the inquisitive type, you have probably also wondered why congestion happens out of nowhere? Here’s your explanation, and I hope you will find it interesting, if you do not know it already.

Instability

You are driving happily along the freeway. Traffic is flowing well but gradually getting denser. As more and more cars get to share the space on the road, traffic slows but continues to flow steadily. At some point you start getting the eerie feeling that danger is lurking. Up ahead, you see brake lights switching on briefly here and there, and you suspect that traffic is close to congestion, so you also shift your foot back and forth between the accelerator and the brake pedal.

When it happens, it comes out of nowhere. Suddenly traffic comes to an abrupt stop. Nothing seems to have caused the event. Traffic just stopped for no obvious reason. The rest of the way to your destination is a frustrating sequence of slow starts and sudden stops. Why does this happen and why can’t the idiots in the other cars just keep going without stopping all the time for no reason? Why does traffic become unstable?

It is not that difficult to work out, actually. It’s a game of space.

The space of a car

To make things simpler, let us assume the road populated by similar cars that drive at equal distances from each other.

Suburbia commuting to work in the morning.

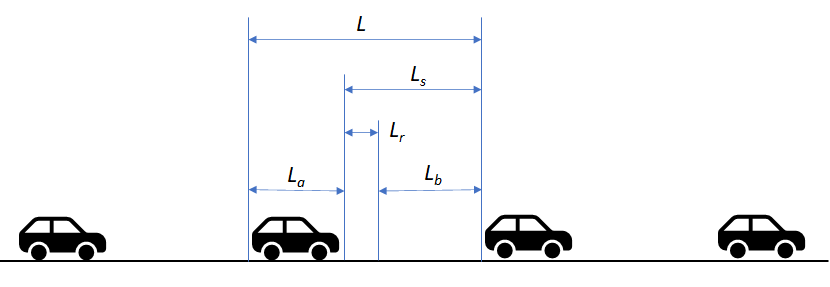
We assume that each car on the road occupies a distance L. This is composed by the length of the automobile, La, plus the distance to the car ahead, Ls. Here, subscript s means “stop” because you learn at the driving academy that this distance should under no circumstances be smaller than the distance required to stop the car from its current speed, lest you may torpedo the car in front of you. If you went to a good driving academy, they also told you that Ls can be decomposed into the sum of Lr and Lb, where the former is the “reaction” distance traveled by the car while you move your foot from the accelerator to the brake, and the latter is the “brake” distance required to bring the car to a halt, after the brake has been activated. From this, we can express L as:

L = La + Lr + Lb

La is just a constant, the length of the car. During the reaction time, tr, the car moves at constant velocity, so we can express the reaction distance as

Lr = trv

The braking distance is a bit more complicated, because it depends on the square of the velocity, i.e. twice the velocity requires four times the braking distance:

Lb = v2/(2a)

where a is the deceleration when braking. This turns out to be the reason for the unstable behavior of traffic, but we will get back to that. For now, let us just notice that higher velocity requires disproportionately more distance to the car in front of you. If you are a decent driver, you know this by instinct.

Flow

Roads are in the business of letting traffic flow from one place to another. The capacity of a road is the amount of traffic is can convey per time, for instance number of cars per hour. This flow capacity, Q, is simple to compute, if we assume that traffic is moving at the velocity v.

Q = v/L

But because L depends on v, the flow capacity depends on velocity in a more complicated way than it appears from the formula above. In fact, it looks like this:

Q = v/[La + trv + v2/(2a)]

It’s time to insert some real numbers. Let us assume that the cars are on the average La = 4m in length. The assumed reaction time depends much on the driver’s age and condition, but it is frequently assumed to be tr = 2 seconds, which seems like much but takes into account that it includes the time taken by the brain to process the situation and decide what to do. The acceleration depends on the tires, the road and the weather conditions, but a reasonable estimate is a = 5m/s2. With this, we can ask: How does the road capacity depend on the velocity of the traffic? Would the road not be able to carry more traffic if people drove faster? Well, here’s your answer:

The traffic flow capacity, Q, for a one-lane road depending on the velocity.

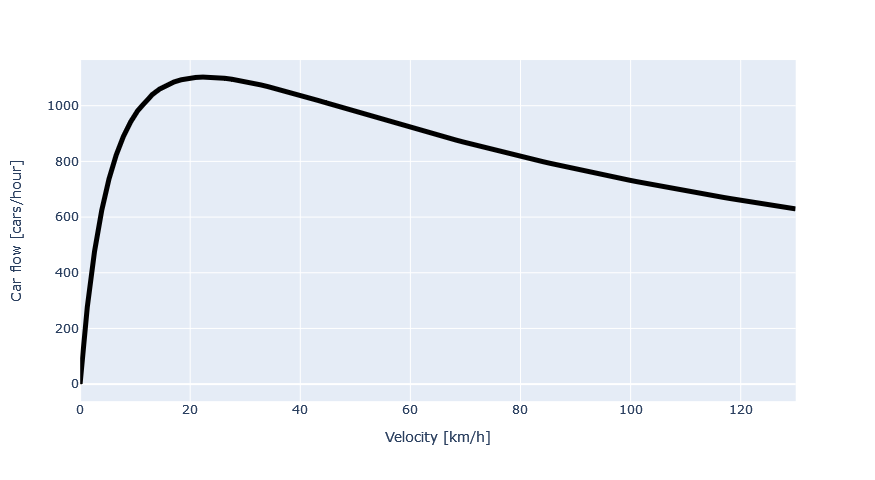
It is not surprising that the flow capacity is zero when the velocity is zero, i.e. traffic does not move at all. When we start the traffic, the flow increases, but it comes to a surprising maximum of 1,102 cars/h at the gentle speed of 23 km/h for the parameter assumptions we have here. The problem is that the necessary distance to the car ahead increases much with the velocity, so the space requirement of each car on the road quickly overtakes the advantage of higher velocity and reduces the flow capacity.

Congestion

Actually, we already have our explanation for the congestion problem: Let us imagine that traffic is flowing at 100 km/h with a low density when more cars enter the freeway from the ramps. The road can accommodate the increased traffic by reducing the speed until we reach a flow of 1,102 cars/h at the speed of 23 km/h. At this point, traffic is locked to this particular speed. Any lower or higher speed will make it impossible to accommodate the traffic that is already on the road, so small perturbations cause nervous drivers to touch the brakes, and the entry of a single additional car from a ramp, in theory, will mean that the problem no longer has a mathematical solution: traffic has no other option than to stop completely. Roads simply have a maximum capacity of cars beyond which traffic can barely flow at all. This is also the reason why it can be so hard to get traffic flowing again after it has stopped.

Disclaimer

Please do not take the numbers in this blog as guidelines for when traffic is safe. Traffic is never safe. The model here is much simplified compared with real traffic, which has vehicles of different lengths and braking abilities and varying road conditions. The best you can do is to maintain a safe speed and distance to the vehicle in front of you. If you feel yourself getting nervous, then you are too close. If you are close and not getting nervous, then you need to brush up on your understanding of physics.

Anybodyrun.com

A model of yours truly running 20 km/h, which is totally unrealistic.

While we have all been in lockdown, my skilled colleagues at AnyBody Technology have worked on an implementation of the statistical running models that I have told you about in previous posts. They have now realized the very vision of this blog: Biomechanics for Everybody. Please go to https://anybodyrun.com/ and try it out for yourself.

The whole point of these statistically founded parametric models is that you can make infinitely many virtual running models that are different in all sorts of ways, for instance in terms of running speed, body anthropometry, step frequency, foot strike type etc. “Infinitely many” means that it is also possible to make a model of you or me.

Of course, they have not made infinitely many, but they did create and process thousands and thousands of models, which are now stored in a database and can be retrieved in an instant in response to your personal specifications on the site. The output presented there is only the running style visualization, peak ground reaction force and metabolic running economy, but each model actually contains an extremely detailed account of every muscle action in every instant of the running process, to the model could potentially return other types of information that are relevant to injury risk, for instance patella ligament for (jumper’s knee) or Achilles tendon force (Achilles tendonitis). My colleagues have promised me that they will add more outputs when they get around to it.

I hope everybody stays safe and that you will be able to spend the holidays with your loved ones.

Simulating running injuries

In this post I continue the presentation of our statistical running models from previous posts but focus more on what we might be able to compute that could directly benefit runners and our knowledge about running biomechanics in general.

To briefly recapitulate, let me mention that we have developed a parametric running model using machine learning techniques on a relatively large sample of real runners that have been measured with motion capture technology. You can read about these developments as far as movement goes in previous blog posts.

The new stuff is that we have now hooked the running model up with detailed biomechanical models that are able to simulate the loads on different tissues depending on the running style.

If you have read the previous posts, you will notice that the main difference is the addition of muscles, which are essential for a complete biomechanical description of the tissue loads.

Let us do an example: The patella ligament connects the knee cap with the bone in the lower leg (the tibia). This ligament transfers almost all the muscle force necessary to extend the knee, and it does so thousands of times during a normal run. It is one of the structures in our bodies that carries the highest loads. This can lead to injuries such inflammation in the tissues, also known as jumper’s knee. The condition is rather painful and very difficult to get rid of, once you have it. Some physio therapists believe that forefoot running will decrease the load on the patella ligament. So, should I take up forefoot running if I get in trouble with my patella ligament?

When scientists ponder how to go about such an investigation, they think about the concept of validity. In brief, validity distinguishes to which extent you are measuring the object of interest directly. The most valid way to investigate the effect of forefoot running on patella ligament loads would be to measure the ligament force inside the living human body. Unfortunately, this type of empirical investigation is very difficult to do. This load is inside the body and we cannot measure it on a living subject for technical, practical and ethical reasons. We could investigate the injury frequency in neutral versus forefoot runners, but they are different people and may differ in many other ways than their running style; we would probably need a very large cohort of test subjects and have to follow them closely for a long time. In cases like these, a computational model may in fact turn out to be more valid than most experiments we could do in practice.

The statistical running model has the advantage that it allows us to do an “all things equal” type of investigation. The model is only a model and not a real person (so it is less valid in that respect), but it allows us to get rid of all the other disturbing factors that can change in real test subjects, while we monitor them, and it allows us to gauge the ligament force directly and not through a derived property such as injury frequency or reported pain.

Let’s try it out. I start by defining a body similar to my own:

Then I specify my running speed at 5 min/km and a neutral foot strike pattern. I could also input step frequency, step length and even input from a running watch or another gadget if I had them.

Then I simulate my running style, and I get this handsome guy:

Notice that the center-of-pressure under the feet begins at the heel and moves forward in the stance phase as we would expect from a neutral foot strike pattern. I can now get the biomechanical parameters of interest from the simulation:

My neutral running pattern creates a patella ligament force of 6.31 times my body weight in the left knee and 6.47 times my body weight in the right knee. It is customary to report figures such as these in terms of body weight to enable comparison between individuals of different sizes.

Why are the data not symmetrical? This is because the movement, from which they are computed, is based on statistics from many runners, and most of these are right-dominant and therefore put a little bit more load on their right leg than on the left leg. I am also right-dominant, so this is all well and good.

I now move the Heel <-> Forefoot slider a bit to the right to simulate a forefoot strike pattern, and then I re-simulate the run and obtain this:

The center of pressure now begins at the forefoot as it strikes the ground as the first. Then it moves back as the foot flattens a little on the ground in mid stance, and forward again for to-off, just as we expected. But is this good or bad for the patella ligament forces? Well, the output will tell us:

The patella ligament force did indeed reduce in both legs, so the PT is onto something, and forefoot running might be a good idea for me if I have trouble with a jumper’s knee. However, if we look at the numbers for Achilles tendon force, then it goes up from 8.34BW to 8.76BW in the left leg and from 8.71BW to 9.49BW in the right leg. This means that, if Achilles tendonitis is my problem, then forefoot running is probably not the solution.

You might also notice that the peak ground reaction force increases a little bit from neutral to forefoot running. This might be counter-intuitive to some, because we think of forefoot running as having a cushioning effect. Cushioning might actually be real exactly at foot strike, but the foot rolls a bit faster off the ground in forefoot compared to neutral running, i.e. it is on the ground a bit less of the stride time. The shorter stance time means that you must apply larger ground reaction forces to keep up with the impulse of gravitation, which is the same regardless of running style.

The patella ligament and Achilles tendon forces we show here are just two among literally thousands of body loading parameters that we can derive from the model, and we can investigate their dependence on running style and body composition parameters to hopefully help runners steer clear of injuries.

More to come…

A biomechanics running app

The running App prototype

While previous posts report on the science behind statistical running models, I have been working on the design of a prototype app that will bring the technology to runners in practice, and I thought Halloween would be a good time to post these rattling, running skeletons.

There is no shortage of running apps on the market. Mobile phones, running watches and designated gadgets can collect information about runners’ performance, calorie consumption, distance and height meters covered, and runners on all levels have embraced these technologies. So what is new here?

Well, current gadgets can collect positional data from GPS satellites, heart beats from skin contact, and accelerations and angular velocities of the body part to which they are attached, for instance the wrist. Forthcoming devices might also have the ability to collect blood oxygenization data via near infrared spectroscopy. Such data are really valuable for assessment of the running performance and load of the physiological system as a whole, but they say little about the actual loads on specific structures that are prone to injury, for instance the hip, knee and ankle joints, the Achilles tendon, other shin tendons, and the plantar fascia. For such structural data we need a detailed musculoskeletal model such as the AnyBody model shown below.

AnyBody musculoskeletal model.

The trouble with detailed musculoskeletal models is that they require detailed input describing the runner and the running kinematics. Big data is going to solve that problem for us as described in previous posts in combination with the little data we can extract from the wearable gadgets and meta data for the runner. The scenario is that you can build and gradually refine a biomechanical model, as the one shown above, of your own physiognomy, and you can make it move with your movement pattern. Then you can simulate loads on your own joints and tendons and investigate different scenarios, such as: How will it affect my injury risk if I take shorter steps? Or: How would forefoot running affect my running economy?

Let us see how it can be done.

Data processing

Data processing pipeline. AMS = AnyBody Modeling System.

In the figure above, you see two fields with different colors. The reddish field on the left contains the processing of big data, which is done offline. There are two sources of big data:

  1. As many motion capture trials as we can get our hands on. Currently, we have about 180 trials in our database. The motion capture data are processed through the AnyBody Modeling System (AMS), returning joint angle histories and anatomical segment lengths.
  2. A database of externally measured anthropometrical dimensions, such as stature, leg length, span between fingertips and such. We have used the ANSUR data comprising about 130 parameters measured on 5000 American soldiers. These data are also processed with AMS to convert them to anatomical dimensions.

A somewhat complicated signal processing algorithm converts the periodic joint angle histories for each trial to Fourier series. We can now describe each running trial by roughly 1200 Fourier coefficients, anatomical parameters and meta data, i.e. we have linked body dimensions, gender and such with running styles.

The little data processing is in the green box to the right. We collect little data specific to a particular subject, such as external anatomical dimensions, gender, running speed, step length and step frequency. Perhaps we also have data available from wearable devices.

Given the little data, an optimization algorithm tunes the parameters of the running model to fit the little data as well as possible. This generates a running pattern corresponding to the little data and relying on big data for any information that we are lacking about the subject in question. I will not go into the mathematics of that process here, but it is very efficient and runs interactively on the user’s device. Once the model for the user is complete, it can be submitted to biomechanical analysis – again with AMS – to compute the biomechanical parameters we were looking for.

Use scenarios

Let us see how this could work. The prototype app was developed with Python and the cross platform tool kivy, which should ensure that it runs on almost any conceivable platform including mobile devices. I run it on my laptop, though, and have not tested it on other platforms yet.

When I open the app for the first time (or reset the model) it presents me with the average runner that you can see below. This imaginary person is 45% man, 55% woman, stands 1.69 m tall, weighs 69 kg and runs 12.4 km/h. Everything here – body dimensions and movement patterns – are generated artificially.

I click the button “My Body” and start inputting my own data. I am a big guy, so I pull the slider to the male side and insert my body mass of 88 kg and stature of 1.91 m.

My own weight and height typed in. The rest of the numbers are predicted.

Although the “little data” are very little at the moment, i.e. just two numbers, all data necessary to generate the model are available, because everything that I did not specify is predicted from the big data. The anthropometric predictions are very simple to check. I can measure the span between my fingertips. The algorithm has predicted it to be 1.97 m, but I can in fact only span 1.93 m, which I type in. Likewise, I measure and register my overhead reach to 2.38 m, and the height to the widest point on my upper thigh, i.e. trochanter major, to 0.99 m. With these partial measurements, I end up with the following table, which ´could be further improved if I took the trouble of measuring all the parameters.

I return from this frame to the main screen, click the “My Run” button, and I get this:

Specification of running parameters

I could type my running speed and other key parameters that I happen to know about my running directly in. But I could also import some data that I have collected with a running watch. Such a device has a GPS, which knows my running speed and it also contains an IMU that registers my step frequency and accelerations of my wrist. I therefore click “Import gadget data” to browse files with running watch data that I have stored. I load a file containing data for a 20 km/h running pattern and get this:

Running data updated after import of IMU data.

I am now ready to “Recompute running style”. It takes a couple of minutes for the musculoskeletal analysis to process the model. The result is the following rendition of my skeleton:

My personalized body proportions and running style at 20 km/h.

The app also informs me that my running economy is 829 J/(km kg) at this running speed. This may not seem very revolutionary given the fact that the running watch can measure my pulse directly, and this will correlate closely with metabolism, i.e. I have not yet computed anything that we could not measure easily. However, the model also computes forces in all muscles and joints, which is something that a running watch will never provide. I will return to this subject in a forthcoming post.

What if…?

But the more interesting feature is actually that I can investigate things that have not happened yet. For instance, what would be the consequence if reduced my running speed to 11 km/h (which is much more realistic in my current form)? Well, I can just go ahead and change the speed in the model and I get this:

A – for me – more realistic running speed of 11 km/h.

This also improves my running economy to 656 J/(kg km). It is not surprising that a comfortable jog is less strenuous than the fast 20 km/h dash.

The “what if” scenarios will later be placed under the “My Goals” button, where we plan to provide tools that can help the individual runner change running style to reduce loads or improve running economy.

Stay tuned for updates on this in a future blog post…

Primal running parameters

(This blog post was updated on 2 February 2019 due to an update of the algorithm.)

In principal component analysis (PCA), we perform a variable transformation from a set of primal and mutually correlated parameters to a set of principal components (PC) that are orthogonal and therefore uncorrelated. Each of these PCs is a mix of the primal variables, so the PCs do not necessarily have a physical interpretation. However, if they do, we tend to think that they have a more serene meaning because the orthogonality means that the significance of each of them is not expressed by any other PC or combinations of other PCs. Also, when we control the model by means of the PCs, every generated running pattern tends to be realistic because the PCs represent variations within the correlated primal parameter space. So it is hard to get something really freaky, which of course is an advantage when we want to generate realistic patterns.

In the previous blog post, I investigated the possible physical meaning of the PCs of running.

However, we often want to recreate a certain physical condition of running, such as a certain running speed, a cadence or a certain size of runner. These parameters and about 550 more are found among the primal parameters of the running model. How can we specify values of those, when the model is controlled by the PCs?

Well, to cut a long story short, the problem of honoring a subset of the primal parameters while keeping everything else “as normal as possible” results in a quadratic optimization problem with linear constraints, for which an analytical solution exists. With this solution, we can play around with models corresponding to specific primal parameters, and this is what I am going to do now.

Running speed

So, what happens, if we vary the running speed and let everything else be “as normal as possible”? The animations below show slow jog at 6 km/h and sprint at 30 km/h.

This seems to work pretty well. It is remarkable that the fast-running model reproduces some of the characteristic features of sprint, even though the set of running trials that were used to train the model did not contain sprint; the fastest running trial in the training set was 18 km/h. The anthropometry also changes because the model contains relationships between anthropometry and running style: The fast runner is almost 2m high.

Shorter runners

But how would a shorter runner cope with very fast running? Well, we can just enforce a stature of 1.50 m instead, which gives us this:

The shorter model seems to maintain the speed by a combination of larger joint articulations and higher cadence, the latter is 1.92 steps per second against 1.83 for the taller model.

Bouncy running

It is also possible to control movement characteristics directly, if they are characterized by any of the Fourier coefficients driving the motion. For instance, the pelvis movement in space can be adjusted this way. The body bounces twice in each running cycle, so its amplitude is predominantly controlled by the second sine and cosine terms in the Fourier series. We can amplify these to create bouncy running, and the remaining coefficients will adjust to try to keep the running style within normal.

Outlook

What it this actually good for? Well, suppose I know something but not everything about how you are running. Some information I can easily find, such as your height, your body mass, and the lengths of all your individual segments can be taken with a tape measure. That’s about 30 parameters just to describe your body roughly. It is also pretty easy to measure your step length and your running cadence, and perhaps I can strap some inertial measurement units to selected points on your body to measure their accelerations when you run. This will give me another 20 or 40 parameters when those motions have been Fourier transformed.

Can I then predict how you or anyone else is running? I don’t know yet, but time will tell and the answer will come to a blog in your sphere.

On the parameters of running

We are making fast progress with our statistical running models, and I can now present a preview of some of the statistical findings.

How many parameters do we need to describe full-body running kinematically? Well, our primal model currently has 551 parameters (it keeps evolving). These include Fourier coefficients for all significant degrees-of-freedom and anthropometrical parameters for the runners. So far, we have not split data into male and female. When we subject these data to Principal Component Analysis (PCA), and we require 90% of the variance explained, then we end up with 39 independent principal components (PCs), each representing a scale of running differences. The figure below shows the relative influence of each parameter.

39 Principal components explaining 90% of the variance in the data set.

So, what are these parameters? Well, each principal component represents a linear combination of the primal parameters. So, when we vary a principal component, we are changing many primal parameters at the same time. To work out the influence of each component in physical/running terms, we can either look at which primal parameters take up the most space in each principal component, or we can simply vary the components to each side, create animations of the resulting models, and look at them to see differences.

In the following, we do both. The animations are made to similar scales, so you can compare the sizes of the skeletons. The slow motion is 30%, and the actual biomechanical models are – of course – developed in the AnyBody Modeling System.

Principal component  0

The 0th principal component (we are computer geeks, so we count everything from 0) is dominated by Fourier terms that control the degrees-of-freedom in the legs, so it appears to be related to leg movement. Here are the animations:

This PC seems mostly express running speed. This is consistent with what we obtained from our previous data set. The fast-running model also appears to be a bit slimmer than the slow jogger, so there is a bit of anthropometry involved as well.

Principal component 1

The top-contributors to this component are the body dimensions, i.e. anthropometry. This also comes out clearly in the animations (remember, the scaling is the same in all animations).

Sure enough, size matters for this component, and the small one seems to be the meanest runner :).

Principal component 2

This principal component is dominated by hip, pelvis and thorax motions, so it should be related to the motions in the core of the body. Let’s see:

For sure, the upper body dynamics is more pronounced in the left runner.

Principal component 3

The data show that this component is dominated by shoulder and arm movements. We now use three standard deviations to elucidate the differences. Let’s take a look:


The significance of this PC seems very be similar to PC2, but the data reveal that the effect of PC3 is concentrated higher up on the body, i.e. in the shoulder region, where PC2 focuses on the thorax and pelvis.

Principal component 4

This is an example where the physical significance is hard to work out from the data alone. The main contributors to this PC are a mixed bag of coefficients for degrees-of-freedom from all over the body. However, the animation is very interesting if you are into running injuries.

The runner on the right has a more upright running style and extends the knees more, and possibly more than what would be healthy in the long – ahem – run. If somebody with this running style had knee or lower leg pain and was seen by a PT, then the recommendation would probably be to reduce the knee extension.

These were just five of the 39 principal components. There is probably more interesting stuff to find in the remaining 26 components, but we are also going to develop methods to explore this 39-dimensional space of running patterns in a more systematic way.

Kinetics

When we add ground reaction force prediction and muscles to the AnyBody models and make them kinetic, then we can also start looking for running styles that minimize or maximize loads on certain injury-prone body parts and, for instance, allow runners with initial stage osteoarthritis to continue running. This is, in fact, the aim of the research project that currently pays for the technological development: Individualized Osteoarthtis Interventions, IOI, funded by Innovation Fund Denmark, whose support is gratefully acknowledged.

Kinetic AnyBody model of a virtual runner with musculoskeletal simulation and ground reaction force prediction.


New data for statistical running

I realize that my previous post on this blog is 18 months ago. What can I say? Science takes time.

In the meantime, my colleagues and I have been working hard on setting up a framework for our statistical running models and finding better data to train the model with. The problem with the existing model is that it is based on manual processing of very heterogeneous data with varying quality, and the 90 trials we based it on were probably not enough to cover all the different ways people run.

In the meantime, we have been able to establish contact to a data source that will provide us with a flow of full-body running trials that are all collected on the same system using the same protocol. This has enabled us to automate the data processing, which does the following:

  1. Processes motion capture marker trajectories through The AnyBody Modeling System to recover anthropometric data of the subject and the running motion for the trial.
  2. Performs Fourier analysis of the trials to find cadence and Fourier coefficients of movements of all degrees of freedom of all trials.
  3. Performs post processing to phase coordinate the trials and remove offsets that do not influence the running patterns.
  4. Performs Principal Component Analysis of the streamlined data to create a parametric running model.

The beauty of this system is that it allows our model to improve dynamically as more data become available, and we eliminate the inevitable errors of manual data processing. Below, you find some examples of processed joint angles for about 100 running trials by different runners.

It is characteristic that some – typically the main joint angles for the running motion – show great similarity between subjects, while others show much more variation. Please stay tuned for updates on this, which hopefully will come sooner than 18 months from now.

Statistical Running

I have recently taken an interest in statistical models of various sorts, where the statistics can be in terms of model anthropometry or in terms of the tasks performed by the model. Two very gifted students of mine, Brian Vendelbo Kloster and Kristoffer Iversen, developed a statistical model of running. Before I write about that model, I would like to give you some background for the whole idea.

CAE

I perceive musculoskeletal modelling as a Computer-Aided Engineering (CAE) tool. More prominent representatives of CAE technology are finite element analysis for solid mechanics or heat transmission, or finite volume models of flow problems. These technologies are used to create virtual models of products before the products exist, and they have enabled much of the technological progress we have seen in recent decades. Mobile phones, modern cars and planes, and large wind turbines are just a few examples of products that would not exist in the absence of CAE.

So, what’s wrong with musculoskeletal modelling? Only the fact that most of our models require experimental input, usually in the form of motion capture data. If I want to model a complex motion like a baseball pitch or ingress into a car, then I need to feed measured motion data into my model to make it move realistically.

We have good interfaces for importing mocap data, so what’s the problem?

Well, if the model needs experimental input, then it can really only model something that happened in the past, i.e. the experiment. And the whole point of CAE tools is to create models of virtual products or situations, i.e. things that have not necessarily happened yet. It is fair to say that models are only real CAE models if they can predict the future.

ADL models

This is where a new class of musculoskeletal models comes into the picture. These models are called ADL Models, where ADL means Activity of Daily Living and can be any recognizable movement or working task that humans perform. The idea is that, if the model already knows in general how to perform the task it was developed for, then it needs only a little more input to do the task in a certain way, and this input could even be dependent on other circumstances or statistically varying within a range.

It is really much easier to explain if we use an example. Let us look at the running model that Kristoffer and Brian developed.

Running model

Watch any crowd of running people and you will quickly realize that different people run in very different ways. The running style also depends much on whether we are sprinting or running a Marathon. Despite these differences, running is a clearly distinguishable motion and we can recognize it easily when we see it. So there might be more similarity than difference to the various styles. The aforementioned two students and I decided to create an ADL model of running.

Running is also a complex motion, so it is not going to happen as a model unless we have some mocap data to begin with. Brian and Kristoffer collected 143 C3D files from various sources, and finally 90 of them turned out to produce reasonable running models. Some of the problems with the remaining models were too much marker dropout or too little of the running cycle recorded.

We then processed all of the models through AnyBody, resulting in the following:

  • Anthropometric data for each subject, i.e. lengths of the segments. This comes automatically from the system’s parameter identification when it processes the marker data.
  • Anatomical joint angle variations for the running cycle for each subject.

Now we could recreate each subject’s anthropometry and running pattern in the system and proceed to do some statistics on the motion patterns. We initially thought that it would not be too hard, but it turned out that there were more steps to the process than we had imagined.

Data reduction and fixing

In the true spirit of ADL models, we aimed to make a parametric model of running, so that we can recreate all sorts of running in a single model. Just one single running model is driven by thousands and thousands of numbers, so we need a vast amount of data reduction. We are going to do this by principal component analysis (PCA) but, in such cases, it is always wise to reduce complexity by smart decisions from the beginning.

The first such decision was to reduce the complexity of each joint angle variation by approximating it with an analytical function using a small number of parameters. Fourier expansions are the obvious choice because running is a cyclic motion. It turned out that all joint angle movements could be approximated precisely by just a small number of terms in the row, maximally 5, and in most cases much less. So each joint angle movement was now represented by less than a handful of numbers.

The transfer of data to Fourier rows carries some additional opportunities with it. Several of the macap trials contained less than a full running cycle, and the trials came from different labs with the subjects running in different coordinate systems. Also, some were running on treadmills, and some were running overground. With the Fourier rows, it is relatively easy to transfer all subjects into the same coordinate system, make the motions symmetrical between right and left sides, and convert all of them to be treadmill running. Of course, this means that the data set does not allow for investigation of asymmetry in running. Finally, we made sure that all movement functions for each trial had the same basic frequency. All of this process we refer to as data fixing.

If you are choking on your coffee now because you think we are messing too much with empirical data, then please remember that the point of this exercise is not to reproduce how any particular person is running, but rather to obtain a data set that spans the parameter space of running.

Ensuring foot contact

We now have parametric models of different people with different sizes running in different ways. For the further use of the model it is important to make sure that each model obtains proper ground contact with the feet. This might not automatically be the case in a parametric model, because the model is driven from the pelvis and outwards. If we, for instance, make the model shorter, then the feet might not reach the ground.

smalllarge

So we recorded the foot motions for each subject, performed another curve fit, and parameterized these curves such that the feet would always touch the ground in the stance phase.

PCA

We now have a big table in which each row represents a running trial, and each column is a Fourier coefficient for the trial. The running style might actually depend on anthropometry; it is not unreasonable to suspect that people with longer legs tend to take longer steps. So we added to each trial the segment dimensions of the subject in additional rows.

Despite all the reductions we were left with 197 parameters describing the running trials.We could go ahead and start playing around with each of those parameters to see how they influence the model. However, this would not be statistically sound for a couple of related reasons:

  1. There is no way that 90 trials can adequately span a space of 197 parameters. We would need many more trials if we wanted the trial space to support 197 uncorrelated parameters.
  2. The parameters are statistically correlated with each other. For instance, the running speed and step length are known to correlate with the elevation of the foot in the forward swing. So random variations of parameters are likely to create absurd motions that do not exist in reality.

Principal Component Analysis is the go-to method to figure out how many independent parameters we need to describe the running motion. So we ran the table of trial parameters through PCA and found that the first three components accounted for 50% of the variance in the data set, and 90% of the variance could be explained by just 12 components. This is illustrated in the figure below.

pca

Let me briefly explain the nature of PCA to those not familiar with the technique: Each of the principal components is a vector of the original parameters; it designates a principal direction in the data set. The principal components are uncorrelated, so we can vary each one independently, i.e. travel along its direction in the parameter space. PCA also tells us how far it is reasonable to vary each vector, because it gives us the standard deviations in each component direction.

Obviously, the first one is the more interesting in the sense that it accounts for almost 30% of the variation. Let us begin the exploration by taking a look at the average running pattern. This pattern is found exactly in the centre of the parameter space of the running trials. I think you will agree that the analysis has reproduced what appears to be a mainstream running motion.

averagerun

We now take the first principal component and displace it by two standard deviations in the positive direction. This seems to produce a running pattern that much less intensive than the average. This guy or girl is really jogging.

slowrun

As expected, changing the first principal component two standard deviations in the opposite direction creates a fast, intensive running motion.

fastrun

We can compare the slow and the fast running by overlaying a couple of keyframes, First we look at the stride:

stride

…and then at the elevation of the heel in the forward swing:

heel

We can see that, as expected, the strides are longer and the heel elevation is higher for fast running. There are also some surprising elements that may indicate that we have to adjust the data processing a bit. It looks like none of the models fully extend the knee. This could be due to a necessary adjustment of the assumed marker locations on the models and would have to be investigated further.

Outlook

We still have to do a lot of data mining left to figure out the physiological significance of the principal components. There is also much work remaining on automation of the data processing. Ideally, we want to create a C3D database of running trials that we can just add new trials to, and the whole processing is repeated automatically. Right now, the curve fitting and coordinate system transformations still need some manual intervention.

The applications of models like these are almost endless. With the parameter space we could:

  • Identify plausible full running patterns for individuals about whom we only know a few things like their size and stride length.
  • Add kinetics in the form of ground reaction force prediction, which we know that we can do reliably in AnyBody.
  • Compute muscle and joint loads as a function of virtual running styles.
  • Offer modellers the opportunity to investigate running without experimental input and ask the model what-if questions.


Up to the challenge

Last week, everybody who is somebody in biomechanics gathered for the 7th World Congress of Biomechanics in the great city of Boston, Massachusetts. Several national and continental organizations serve the biomechanical community, and they all have their own congresses, but every four years all of them get together in one big and all-encompassing conference. This time, the World Congress hosted more than 5000 delegates.

For me personally, and for several of my closest colleagues, this was a very positive event. There is a much-increased interest in simulation methods in general and in the AnyBody Modeling System in particular. It has been a long time coming, and I have felt at times that we had to explain over and over why it is reasonable to believe that the laws of mechanics apply to the human body and that we would, despite challenges, get it right if we stuck to that belief and kept refining the models and software.

This year, many applications of AnyBody were presented by independent research groups, some of them by unrelated initiatives and some under a competition named “The Grand Challenge”. A visionary group of scientists headed by B.J. Fregly, Darryl D’Lima and Thor Besier have now five times published data sets containing in-vivo measurements of knee forces from an instrumented implant and challenged the simulation community to predict these forces. Every generation of data contains a new activity, and the contestants initially do not know what the correct forces are, so it is a truly blinded test. After the estimates have been submitted, the true values are revealed, and the participants are now challenged to improve their models and predictions.

For this year’s competition, my colleague Michael Skipper Andersen headed a strong group of scientists related to the TLEMSafe project, more precisely Marco Marra, Valentine Vanheule, René Fluit, Nico Verdonschot and yours truly. Not only did we win; our prediction was the closest in the history of the competition. The second place went to a Korean group also using AnyBody but with a completely different model. This should finally silence any doubt that musculoskeletal simulation indeed can simulate forces inside the body.

GrandChallenge

I often compare the evolution of musculoskeletal modeling with the development and adoption of finite element analysis. When I was a student in the 1980’ies, I was extremely fascinated by the possibilities of finite element analysis for the solution of engineering problems when, and I did my PhD in this field, developing my own shape optimization system and its associated finite element solver bottom-up in Pascal. It was quite challenging at times, due to the lack of programming tools and debuggers but also because of the lack of understanding. Many older professors completely misunderstood the project, even when the results began to appear, and I remember particularly one instant when a slightly cranky one cornered me and started shouting agitatedly into my face that “this finite element shit will never amount to anything – ever!”

Time proved him wrong and very few of the hi-tech products we use today, from mobile phones to wind turbines, could have been developed in the absence of finite element simulation in the design process. I have felt since the beginning of the AnyBody project that musculoskeletal modeling is on the same path and holds the same potential.

To accomplish that goal we must also look to the way CAE in general is used: We rarely make finite element models of bridges that are already built or last year’s car model. We make models of future bridges or the bodies of cars to be marketed in three or five years; we simulate the future. The real challenge of musculoskeletal modeling is to make the technology reliable enough to be used for prospective analysis. So far, most musculoskeletal models have simulated retrospective situations for which experimental input data, for instance from motion capture and force platforms, is available, i.e. the past. This might be interesting for research but it is not what makes the technology valuable to a large group of users in healthcare and in the industry. The real potential is simulation of situations that may happen in the future: the outcome of a possible surgical procedure, the behavior of a new type of joint prosthesis, the ergonomic quality of a new hand tool or working environment being designed.
To make this happen, we must meet at least three additional challenges:

  1. Models must be able to represent individuals for healthcare applications as well as statistical cross sections of the population for product design.
  2. Models must be independent of force input, typically from force platforms.
  3. Models must be independent of motion input.

These three challenges will define much of the research of my group in the forthcoming years. Let me try to give a brief status on this:

Statistical shape modeling was a big topic at the WCB2014 and in the biomechanical community in general, and this will eventually benefit AnyBody models. We have also with good partners made much progress in the realm of the TLEMSafe and A-FOOTPRINT EU projects in terms of individualization of the models. We can do it, but it takes time and the workflow must be improved.

AnyBody relies on inverse dynamics, which has a legacy from classical motion analysis. It is therefore a popular misconception that force input is absolutely needed. This has never been the case due to the very general mechanical formulations used inside AnyBody, but we have used force platform input when it was available because we thought that it is better to use real data when we have them. At WCB2014, Michael Skipper Andersen with co-authors Fluit, Kolk, Verdonschot, Koopman and Rasmussen presented the paper “Prediction of Ground Reaction Forces in Inverse Dynamic Simulations”, which very convincingly shows that ground reaction forces can be predicted with great accuracy from kinematics and without increased computation time.

The final, and severest, challenge is to predict motions. Saeed Davoudabadi Farahani from the AnyBody Research Group recently had a paper accepted that convincingly predicts cycling motions, and another paper on squat jump motion prediction is under review. Stay tuned for those. The status in this field is that we can predict simple motions reliably, but the computation times are still too high and there are open questions regarding prediction of abstract working tasks.

We will not run out of scientific challenges any time soon, but we are up to them and WCB2014 shows that we have come a very long way.

I wish everybody on the Northern Hemisphere a great summer vacation.

20/20 vision

They say that hindsight is 20/20 vision; we are always so much smarter when we look back than we were when we tried to navigate forward in a difficult world. My famous compatriot, Søren Kirkegaard, said it better than anybody else: “Life can only be understood backwards; but it must be lived forwards.”

The end of the year is usually the time to look back and evaluate a little. A few years ago, I helped starting a research project called AnyBody Inside in cooperation between AnyBody Technology and the research group that I am heading at Aalborg University. The purpose of the project, funded by the Advanced Technology Foundation, was to prepare the AnyBody Modeling System to be used “inside” in several ways: Inside other software and for applications inside the human body such as surgical planning, design of joint replacements and dimensioning of trauma devices. Along the way we were also fortunate enough to get invited into several EU research projects by outstanding project coordinators: SpineFX, A-FOOTPRINT and TLEM/Safe are all projects that contributed enormously to the development of AnyBody.

Before we got to this point, we had been thoroughly discussing the direction of our research and development. The analysis showed that out of all the directions we considered, orthopedics was by far the more difficult technically and, yet, that was the way we went. In hindsight it may not look like the smartest choice to head directly towards the highest mountain we could see, but that choice says much about the resilience and determination of the people I am working with. The fact that they have now climbed the mountain says much about their unusual skills. Over the past decade, they have created a world-leading technology for musculoskeletal simulation using an amazing ingenuity and solving problems nobody have previously been able to tackle. I apologize for a bit of self-indulgence at the end of the year, but I think this is a good time to review some of those achievements: some that are already out, and some that will be published and marketed in the New Year:

We have been integrating AnyBody into workflows that are used by engineers and scientists. AnyBody is no longer a stand-alone technology. Functional environments, i.e. assemblies, can be imported from SolidWorks into AnyBody and hooked up with the human musculoskeletal model. The video below shows one of my favorite models conceived in the wonderfully curly mind of my genius colleague, Moonki Jung. I call it the Steampunk model, but it really just demonstrates how a mechanism developed in SolidWorks can be imported with kinematic constraints, CAD part geometries and even surface colors from CAD to AnyBody.

In a downstream data direction, we have also integrated AnyBody with finite element software. The idea is that most of the daily loads on the skeleton come from muscle forces, so they are essential to include in any realistic FE model of bones and joints. We even published an investigation of that importance (Wong et al. 2011). Any FE code can be fed forces from AnyBody with a small effort of user interface scripting, but if you are lucky enough to use Abaqus or ANSYS, then you can benefit from more automated interfaces. The image below is from a recent paper that analyzes the stresses in a clavicle fracture fixation device (Cronskär, Rasmussen & Tinnsten 2013).

claviclestress.tif

Without going too much into technical details, I can say that the type of analysis performed by AnyBody usually requires an assumption of idealized joints, for instance a hinge for thee knee. That may be fine for ergonomics, but any anatomist will agree that the knee is far from a hinge if you look a little closer. It is much more complex and some of its movement is due to elastic deformation of soft tissue such as ligaments and cartilage. In AnyBody we have a few people exceptionally skilled in mechanics and mathematics, Michael Skipper Andersen, Michael Damsgaard and Daniel Nolte. Together they developed the necessary surface contact algorithms and an entirely new biomechanical analysis method: Force-dependent kinematics. This allows, for the first time ever, to perform analysis of very complex musculoskeletal systems with hundreds of muscles and detailed modeling of complex joints such knees, shoulders (GH joint) and tempora-manidibular joints. This is already available in the AnyBody Modeling System, and a publication about the technique is being prepared. The video below shows the deformation in a knee simulated with FDK. Notice the shift in the joint in response to the impact force at heel strike just at the beginning of the video. 2014 will bring lots of really interesting applications of this new technology.

The whole purpose of a simulation technology is to predict how the world works, in particular what will happen if we intervene in some sense: perform surgery to correct pathological gait, implant a joint replacement, change a workplace or alter the design of a bicycle. Some of these interventions will change the movement pattern, and movement is input to the type of analysis we perform in AnyBody. So how can we compute something that we need as input for the same computation? It seems like a catch 22 problem, and this is where posture and motion prediction comes into the picture. Saeed Davoudabadi Farahani is working in this field, which is still in its early days. We are trying to prove that optimality principles can predict the way we move, and the results are looking good. Below is a picture of a predicted squat jump. Stay tuned for more on this in 2014.
SquatJump

The final issue I want to mention is verification and validation, V&V. Any technology with aspirations to get used for serious tasks should go through these processes and particularly Morten Lund has been looking into this and has published a rather comprehensive review. One of the things we have found is that V&V is an ongoing process. You cannot just V&V a complex software system and then tick it off as done. So we have been developing what we call a validation engine. This tool runs new software versions and model library models through a comprehensive sequence of tests and compares the results with previous results as well as published experimental data. I fully expect that this will set a new standard for V&V in musculoskeletal systems in 2014.

Oh, and 20-20 vision is also what I expect from myself after a small piece of clinical biomechanics performed on my eyes on January 15th: I shall have the lenses in my eyes replaced. They have become rigid as it happens to us all around the age of 45 or 50, so I am unable to focus on more than one distance and must use glasses. An advanced laser will pulverize the stiffened contents of my current lenses, and a surgeon will remove the debris and insert a new, multifocal lens that hopefully will restore my vision to its former strength. This procedure is performed more than 15,000 times per year in Denmark alone and is a wonderful example of how science is improving the lives of ordinary people. Let’s use our biomechanical skills to do the same with osteoarthritis and other musculoskeletal diseases in 2014.

References

Cronskär, M., Rasmussen, J. & Tinnsten, M. 2013, Combined finite element and multibody musculoskeletal investigation of a fractured clavicle with reconstruction plate, Taylor & Francis.
Wong, C., Rasmussen, J., Simonsen, E., Hansen, L., de Zee, M. & Dendorfer, S. 2011, “The Influence of Muscle Forces on the Stress Distribution in the Lumbar Spine”, The Open Spine Journal, vol. 3, pp. 21-26.